
When Maren asked me to update a presentation that I made in 2015 – which rejoiced in the title “’I watch the ripples change their size but never leave the stream’: Trends and patterns in education technology prediction” I don’t think either of us really remembered what the session was about.
What I was trying to do back then – and there must be something wrong with my calendar because that was apparently eight years ago – was to understand the nature of prediction within the domain of education technology. I wasn’t the only one – the legendary Audrey Watters was on a similar tip, and I am as indebted to her work now as I was at the time. There’s been a few other notable entries in this microgenre of “histories of the future of education”: Martin Weller’s “25 years of edtech” is an actual real book you can buy and everything, and was developed in response to ALTs 25th anniversary.
On the surface looking at old predictions is one of the cornerstones of clickbait culture. We look at old predictions for lulz, basically – we like to point and laugh at how stupid (or optimistic, or prejudiced, or lol-random) people used to be, and compare that to our semi-automatic premium-economy air-conditioned capitalist utopia that they could never have possibly envisaged with their stupid past-brains.
On the other hand, new predictions are a very Serious Business – robust operations usually performed by very Serious Men (and it is always men…) who can demand that we regulate AI before we see civilisation collapse, or that we are sure to buy just the right NFTs. Or that we all climb aboard the MOOC train before it leaves the station. Or whatever.
New predictions are equally as funny as old ones. Happily Gartner’s Hype Cycle appears to have vanished off the cliff of obsolescence – I used it heavily in 2015 but it apparently disappeared from our collective frame of reference in the years since. And, interestingly, since 2020 the former NMC horizon scan has moved away from explicit prediction (with the time scales and everything) all together.
But there’s always an edge to predictions. Purely disinterested ones are rare. Back in 2015 I developed a typology that I want to briefly revisit:
- Flying car predictions are predictions that are really based on nothing other than “wouldn’t it be cool if…”. Flying car predictions are unlikely to happen, and most likely wouldn’t work if they did. The classical idea of a “moonshot” plan comes from this line of thinking, though moonshot-style ideas are seldom both successful and transformational. Flying car predictions are most likely to be commercial in scope – claiming something might be cool often goes hand in hand with selling goods or services that would make this otherwise unevidenced need fulfillable.
- Extrapolation predictions are based on an expectation that things will continue to progress in the way they are currently progressing. For the bulk of the modern era, predictions of this sort have been useful if not always accurate – increasingly these kind of predictions can be and are automated (and yes, we’ll get into that). “Black swan” events – rare but likely – most recently the 2008 banking crisis, the 2016 collapse of liberal society, the 2020 pandemic, and arguably the growth of the internet since the 90s, are the major disruption in this form of prediction.
Importantly, not all extrapolation predictions will agree with each other. The selection and interpretation of data may mean that an “extrapolation” prediction tends towards the “flying car” or “Swedenborgian” end of the spectrum
- Swedenborgian predictions (yep that’s a reference to the c18th Christian mystic, Dominic Cummings has nothing on me…) are similar to flying car predictions in that they represent wish-fulfilment, but are based a desire to be proven ideologically correct rather than a general desire for coolness. These are usually in opposition to prevailing trends, using conceptual language based around apocalyptic ideas (“the death of X”, “X is broken”….), but forecast a resurgence and prevalence of an alternative mindset closer to that favoured by the predictor.
It is possible to argue that “flying car” and “extrapolation” predictions are also “Swedenborgian” as they are predicated on the maintenance of our dominant ideology to at least some level. However, for the purposes of this presentation I have chosen to use this category only for insurgent ideology that is in opposition to the mainstream.
Each of these can either be an “expert” prediction – drawing on an established body of expertise that is distinct from information available from the market, or a “lay” prediction where information from the market is used in a way that does not require a specific domain expertise.
What I was doing in 2015 was to come up with and approach that would lead to a lay extrapolation prediction for education technology – using the public data that is what is presented at ALT-C to make an analysis of what might be now and next in edtech, and proving this by looking at how well the historic themes I identified mesh with other approaches (like the NMC Horizon scan) and our own fallible memories of the time.
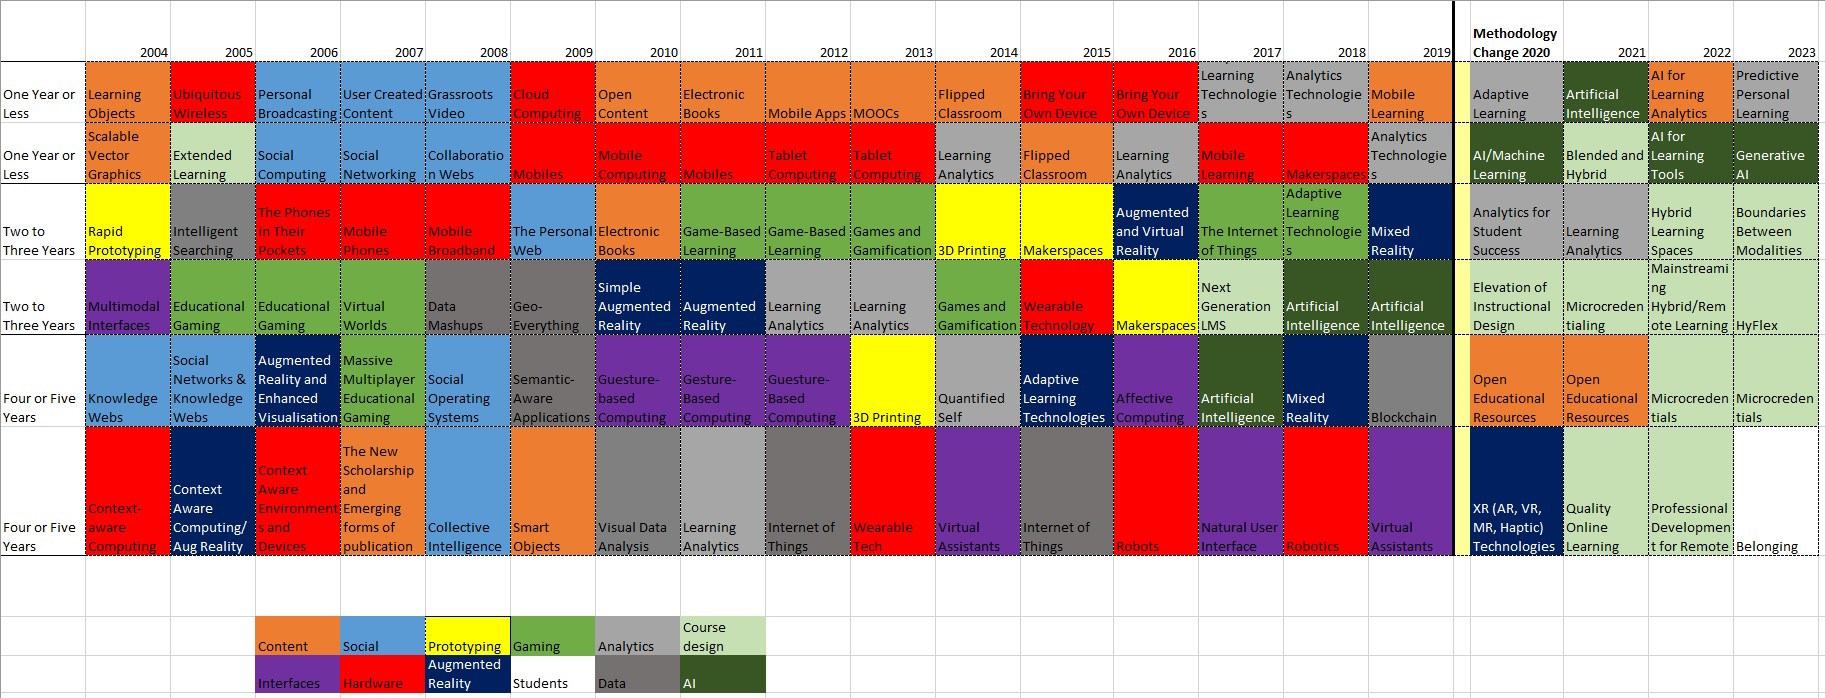
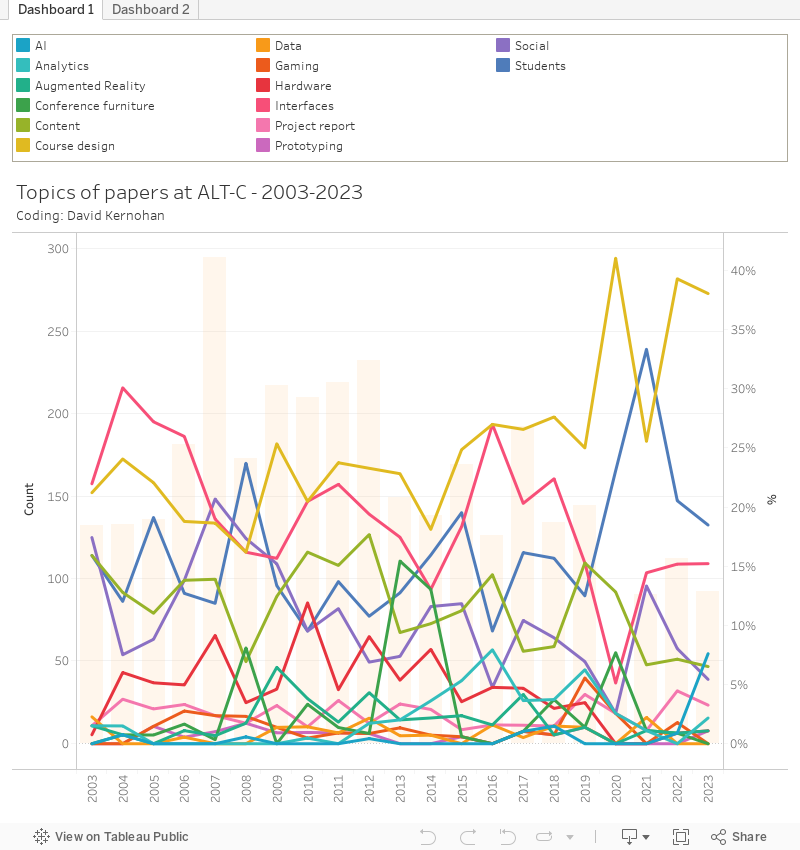
What I’ve done this time is to identify and code sessions from every iteration of ALT-C between 2002 and 2023. Here’s a chart:
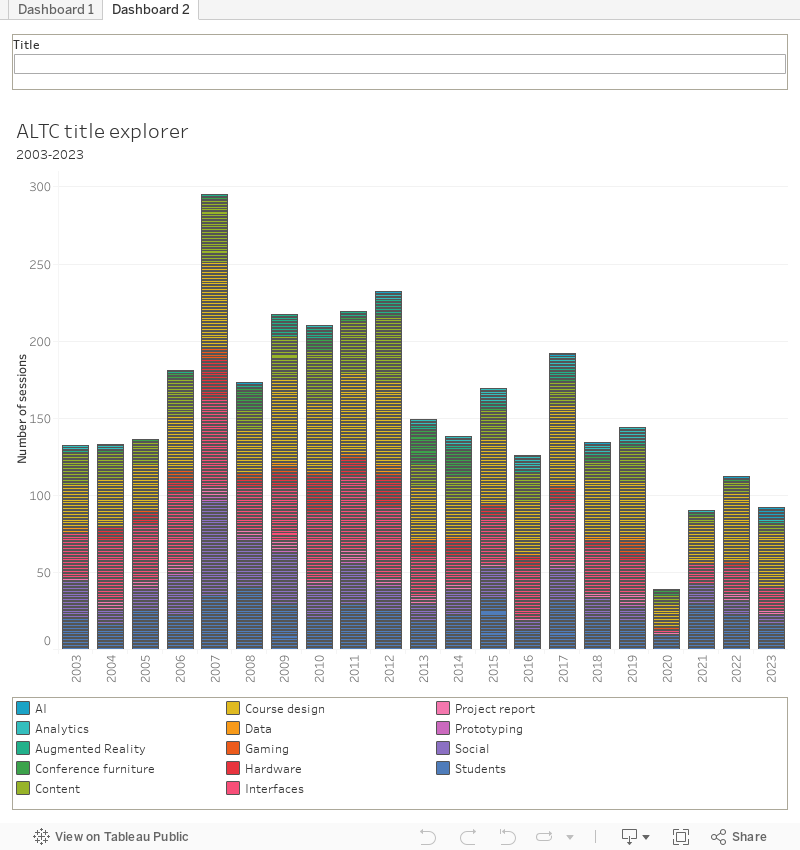
And here’s a title explorer:
To show this working – note that nearly 20 per cent of all papers presented at ALT-C 2007 concerned social media approaches in some form, and nearly every entry on the NMC roster had a similar focus. We know that this was around (or slightly before) the peak of what we now think of as the Web 2.0 movement – folksonomies, PLEs, and all – and the fertile ground from which the cMOOCs grew.
It was a good time – for those of us who were there (I think it may have been my first ALT-C). But a lot of what we then thought, about the power and adaptability of social media approaches, has been shown to have major flaws. As Scott Leslie had it, “love doesn’t scale”.
To take another ALT-C perennial, virtual worlds (from augmented reality through the behemoth that was second life) there are three smaller peaks – 2009, 2012, and 2017. This doesn’t really mesh with NMC predictions, or with google trends. Have virtual worlds ever had their moment? Will they ever? On the evidence we’d have (logged on to the metaverse recently?), we need to predict that it will remain a background concern into the immediate future.
And with analytics – the use of what is administrative and management data to plot and predict student achievement and engagement – we see peaks of ALT interest in 2016 and 2019, but the idea has been bubbling under at NMC since 2014. Martin Weller, with the benefit of hindsight, pegs the peak at 2017.
As an extreme example, most of the sessions concerned with learning during a pandemic happened – as you might expect – since 2020. Apart from one – in 2010 Jane Mooney, Pete Driscoll, and Lee Griffiths presented “Pandemic planning – from paper to pixels”. The abstract tells us (and abstracts for anything at ALT are few and far between at this point) about a means to support problem based learning in public health planning using a Nintendo Wii and a projector.
In conducting a thematic analysis of the discussions that take place at ALT-C (an annual academic conference concerned with education technology) I’m very likely to get bogged down in methodological questions as much as I am the history of edtech (such as it is possible to speak about such a thing).
Every experience of ALT-C, or the wider conversation around education technology, is a subjective one – though I can talk about what might have been on offer across the whole conference I can only offer my interpretation about what was discussed. We all do this – we have this ability to scan a programme and decide what is of interest to us and what is not. We can do it in a variety of ways, and filtering by topic is just one of them.
Likewise, any assessment of the wider sphere of edtech at a given point in time can only be that of the people who are doing the assessment. If you look at something like the NMCs Horizon Scan (or even something as ostensibly organic as google trends) you see the interpretations of the loudest, or the keenest – or even those with most to sell.
We can’t ignore the surrounding context either. From the early 00s through to around 2012, large numbers of ALT-C presentations exist because Jisc funded projects that needed a dissemination strategy – so in ALT presentations we are getting a round up of what Jisc was funding in the years previous to each conference. Some 30 per cent of presentations at ALTC 2004 were about what I’ve loosely called interfaces – ways to use computers to introduce students to content and assess their performance – because in the early 00s Jisc was funding experimentation around the MLE/VLE/LMS under the aegis of the IMS interoperability standards portfolio.
What of it? Well, the MLE we dreamed of is not the MLE we got, but looking back through the titles the concerns are the same. How do we drive engagement online? How do we make these approaches accessible to groups of students with specific needs?
So, in looking through these records there is a circularity in concerns that tells us something else – either that some problems are never going to be solved, or that as a community we need to get better at learning from our predecessors. And we could be forgiven for the latter on the grounds that even finding out what was presented at a previous ALT-C is not easy.
In pulling together the data that underpins this visualisation, it was comparatively late in the day that I found any documentary proof that ALT-C 2008 ever happened. Which is bizarre, as I was there. The combination of a collapsing “web 2.0 for conferences” start-up and the vagaries of web archives meant there was no list of papers at ALT for that year available anywhere. In the end I had to ask Maren to scan the single available hard copy in for me.
The data I have (and will release) openly is of varying quality. There’s an inconsistency in the type of information I have been able to find – as timetabled, as presented, even as submitted. I’ve not had the capacity to clean (or in some cases transcribe) the data as well as I might have liked (and I want to thank Learning Technologist of the Year 2008 Vivien Rolfe for her help there). I stopped at 2003 because I only have data for one day of ALT-C 2002 – there’s nothing for 1996 or 1998 at all.
And the purpose and format of ALT-C has changed over the years too. The first ALT-C, in 1996 happened in Hull – and had the overall theme of “Enabling Active Learning”. The aim, as expressed in the conference brochure, was to identify WINNING SOLUTIONS – “from corporate strategy to courseware design, from supporting students in the use of technology in learning to the inspired use of tools and techniques”.
Being a “learning technologist” back then wasn’t really a job – more a part-time vocation for enthusiasts (and those supported by a range of funding available from HEFCE to explore such questions). ALT itself came from the HEFCE funded Computers in Teaching Initiative (CTI) as an interest group for mutual support more than a means of dissemination. CTI of course, is one of the main roots of what became (eventually) Advance HE – much of what is now the independent system of quality enhancement and teaching innovation began as funded interventions at a time when the improvement of teaching quality in higher (and further education) was seen as a national priority.
So that’s a lot of words to say that all this is, like, just my opinion, man – and you might wonder why I bother, given that subjectivity is hardly a novel or complex idea. On the other hand, I am – by profession – an observer and interpreter of Things. In other words, a journalist. And though I’ve held various roles at the intersection of education technology, education research, and public policy it is not hard to conclude that I’ve basically always been a journalist and thus a professional observer of things. They say, after all, that journalism is the first draft of history (and I said, once, that blogging is the notes you make before you start writing). What I am getting at here is that you might chose to trust my interpretation because I do a lot of this kind of thing – but you shouldn’t take everything as an accurate description of the moment.
The lifespan of ALT – as Martin Weller notes is the lifespan of the internet. Sure, there’s been edtech before that, and there will be edtech after the internet too. The early 90s marked the end of what Eric Hobsbawm called “the short twentieth century”, characterised infamously by Francis Fukyama (in a book more cited than read these days) “the end of history”. It was clearly the end of something and the start of something else – and if that something else was the internet it feels like things are drawing rapidly to a close once again.
ALT has primarily focused on connected technology as a force for good – in education, and by extension, in culture. This has been alongside rather than against the dominant narrative of the time – we’ve seen a push to get students onto the internet change into a need to protect them from it, and a policy presumption about the radical reform of higher education on digital lines shift towards protectionism based on an (imagined) pre-lapsarian age.
We can’t really see education technology per-se outside these trends – the surveillance state and the quantified self both have more than a little to do with analytics. The skills agenda is at least partially an unskills agenda – replacing expensive undergraduate degrees with bite-size modules.
The days of “internet as force for good” may be passing – the days of “social media as force for good” have long since gone – but there are further days ahead in the grand story that is using technology in higher education. And ALT will be there for it.
[Data] (.xlsx)
This is a look at the history of the Association for Learning Technology (ALT) and the fine art of prediction in ed tech. Prediction has been a subject of OLDaily over the years as well, and I would humbly say I’ve been pretty good at it. That said, I did enjoy David Kernohan’s discussion, especially the classification of prediction tropes (‘flying car predictions’, ‘extrapolation predictions’, ‘swedenborgian predictions’). I also liked his attempt to identify and code ALT sessions for every year since 2002 (though the colours are so similar it’s really difficult to identify which is which on the chart – the trick is to navigate your mouse over the precise point where a line crosses a year to see the little popup). The top topics year in and year out are ‘course design’, ‘students’, ‘interfaces’ and ‘content’ – which tells us more, I think, about a conservatism inherent in education (even in ed tech!) that makes good prediction a lot harder.